Cannabis Use Disorder Dashboard

Know how your clients are doing before they walk in the room

SmokingTracker's practitioner dashboard turns objective EMA data into actionable clinical insight. Traffic-light status, trend charts, and trigger analysis — all waiting for you when you open the session.

Measurement-Based CareReal-Time DataMulti-Client View
Risk stratification

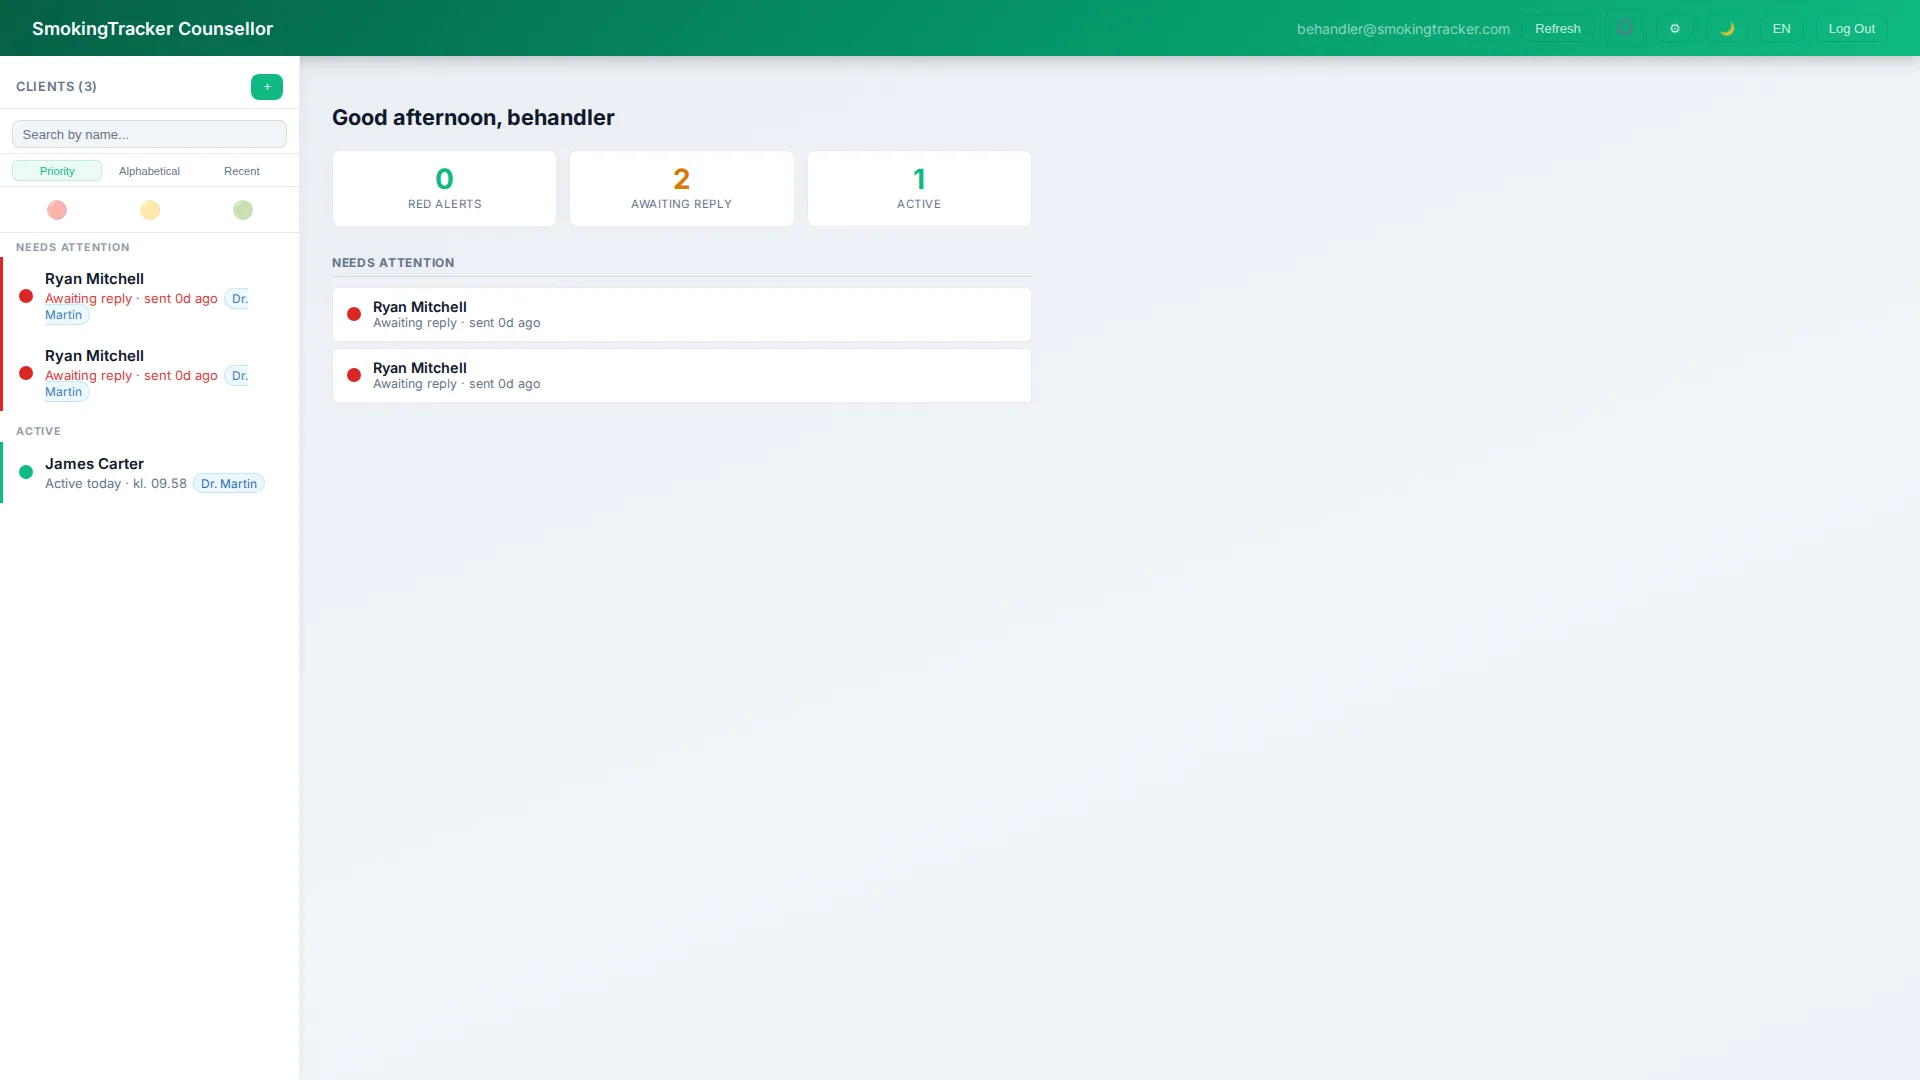
A traffic-light system that tells you who needs attention today

Every client on your caseload shows a risk status calculated from their EMA data — frequency, consumption trend, mood trajectory, and craving intensity. Identify escalating cases without reading through raw logs.

Green — On Track Use frequency stable or decreasing. Mood and craving scores within target range. No fast-use warnings this period.
Yellow — Watch Increasing frequency or craving scores. One or more fast-use events. Mood deterioration trend detected.
Red — Needs Attention Significant escalation, missed logging streak, or sharp mood drop. Prioritise at the next clinical contact.
Practitioner patient list with traffic-light risk status indicators
Client detail view

Everything you need for the session — in one scroll

Open any client and see their complete picture: calendar heatmap of logged sessions, frequency and consumption trends over time, mood and craving trajectory, top triggers, and a chronological activity feed. No piecing together spreadsheets.

  • Session calendar heatmap — see use patterns at a glance
  • Frequency and quantity trend lines over 4, 8, or 12 weeks
  • Mood and craving scores plotted alongside use events
  • Trigger breakdown: stress, social, boredom, habit, pain
See how this turns into a PDF report →
Client detail view showing cannabis use trends and mood data
Analytics & methods

Understand which methods and substances are driving use

Cannabis is not one substance. Flower, concentrate, edible, and vape have different onset times, potency profiles, and behavioural patterns. SmokingTracker breaks down your client's use by method so treatment targets are grounded in actual behaviour — not generalised assumptions.

  • Use breakdown by substance type and administration method
  • Time-of-day and day-of-week pattern analysis
  • Co-occurrence of use with stress, cravings, and mood states
  • Goal adherence tracking — use vs. reduction targets
Learn about measurement-based care →
Analytics breakdown by cannabis method — flower, concentrate, vape, edible
Session notes & flags

Add clinical annotations directly to the data

Attach session notes, flag significant events, and track treatment milestones alongside the objective EMA data. When you generate a PDF report, your annotations appear in context — making the document session-ready and referral-quality without extra formatting work.

  • Free-text session notes attached to any date
  • Flag events — relapse, goal achievement, medication change
  • Notes included in exported PDF reports
  • Full audit trail — timestamps on all entries
See one-click PDF reports →
Clinical notes and annotations in the practitioner dashboard
Clinical Evidence

Why real-time data outperforms recall in CUD treatment

The case for objective, session-by-session tracking is well-established in the addiction literature.

Measurement-Based Care

MBC reduces symptom severity by 58% compared to treatment-as-usual

Systematic reviews of measurement-based care across substance use disorders consistently find large effect sizes when clinicians use objective outcome data to guide session decisions.

Self-Report Bias

Clients underreport cannabis use by 30–50% on retrospective questionnaires

Studies comparing EMA capture to weekly retrospective recall consistently find that recall-based methods miss roughly half of actual use episodes, especially in heavier users.

Treatment Engagement

Clients who receive regular progress feedback are 2× more likely to stay in treatment

Feedback-informed treatment (FIT) trials demonstrate that sharing objective progress data with clients improves alliance and retention — a direct clinical use case for the dashboard.

Trigger Analysis

Identifying proximal triggers doubles the effectiveness of coping skills training

CBT and contingency management protocols perform better when trigger work is grounded in the client's own EMA-identified pattern data rather than generic high-risk scenario lists.

Selected references:

  1. Scott K & Lewis CC (2015). Using measurement-based care to enhance any treatment. Cogn Behav Pract.
  2. Hjorthøj CR et al. (2012). Agreement between self-reported and documented cannabis use. Addict Behav.
  3. Lambert MJ et al. (2003). Is it time for clinicians to routinely track patient outcome? Clin Psychol Sci Pract.
  4. Witkiewitz K & Marlatt GA (2004). Relapse prevention for alcohol and drug problems. Am Psychol.
How It Works

From client invite to clinical insight in minutes

1

Invite your client

Send a secure link from the dashboard. Your client creates an account and begins logging immediately — no app store, no lengthy setup. You're connected in under two minutes.

2

Data flows automatically

Every session your client logs appears in your dashboard in real time. Trend charts, risk status, and trigger analysis update continuously — no manual imports or check-ins required.

3

Open prepared, close informed

Check the dashboard before each session — review the week's data, note any escalations, add session annotations. Export a one-click PDF when documentation is needed for EHR or referral.

Related Features

Get full dashboard access during the free pilot

No setup fee. No automatic charges. Full dashboard access for your entire caseload.

Want to see it in action?

Request access and see how SmokingTracker can support your treatment center during the current free pilot.

Start Free See Pricing
Currently free until October 2026 · No setup fee · No automatic charges