SmokingTracker generates structured reports from your client's objective EMA data — trend charts, session annotations, and trigger analysis formatted for EHR entry, supervision, or referral. Print or save as PDF in one click. No copy-pasting. No manual charts.
Visual heatmap of logged sessions across the report period — frequency, pattern, and gaps visible at a glance.
Week-by-week frequency and consumption volume plotted as a line chart — ideal for tracking reduction progress.
Mood rating and craving intensity plotted alongside use events — shows the emotional-use relationship over time.
Ranked breakdown of the client's logged triggers — stress, social context, boredom, habit, pain — with session count per category.
Pie breakdown by administration method (flower, vape, edible, concentrate) and substance type with percentage split.
Your session annotations and flagged events appear in chronological context alongside the objective data.
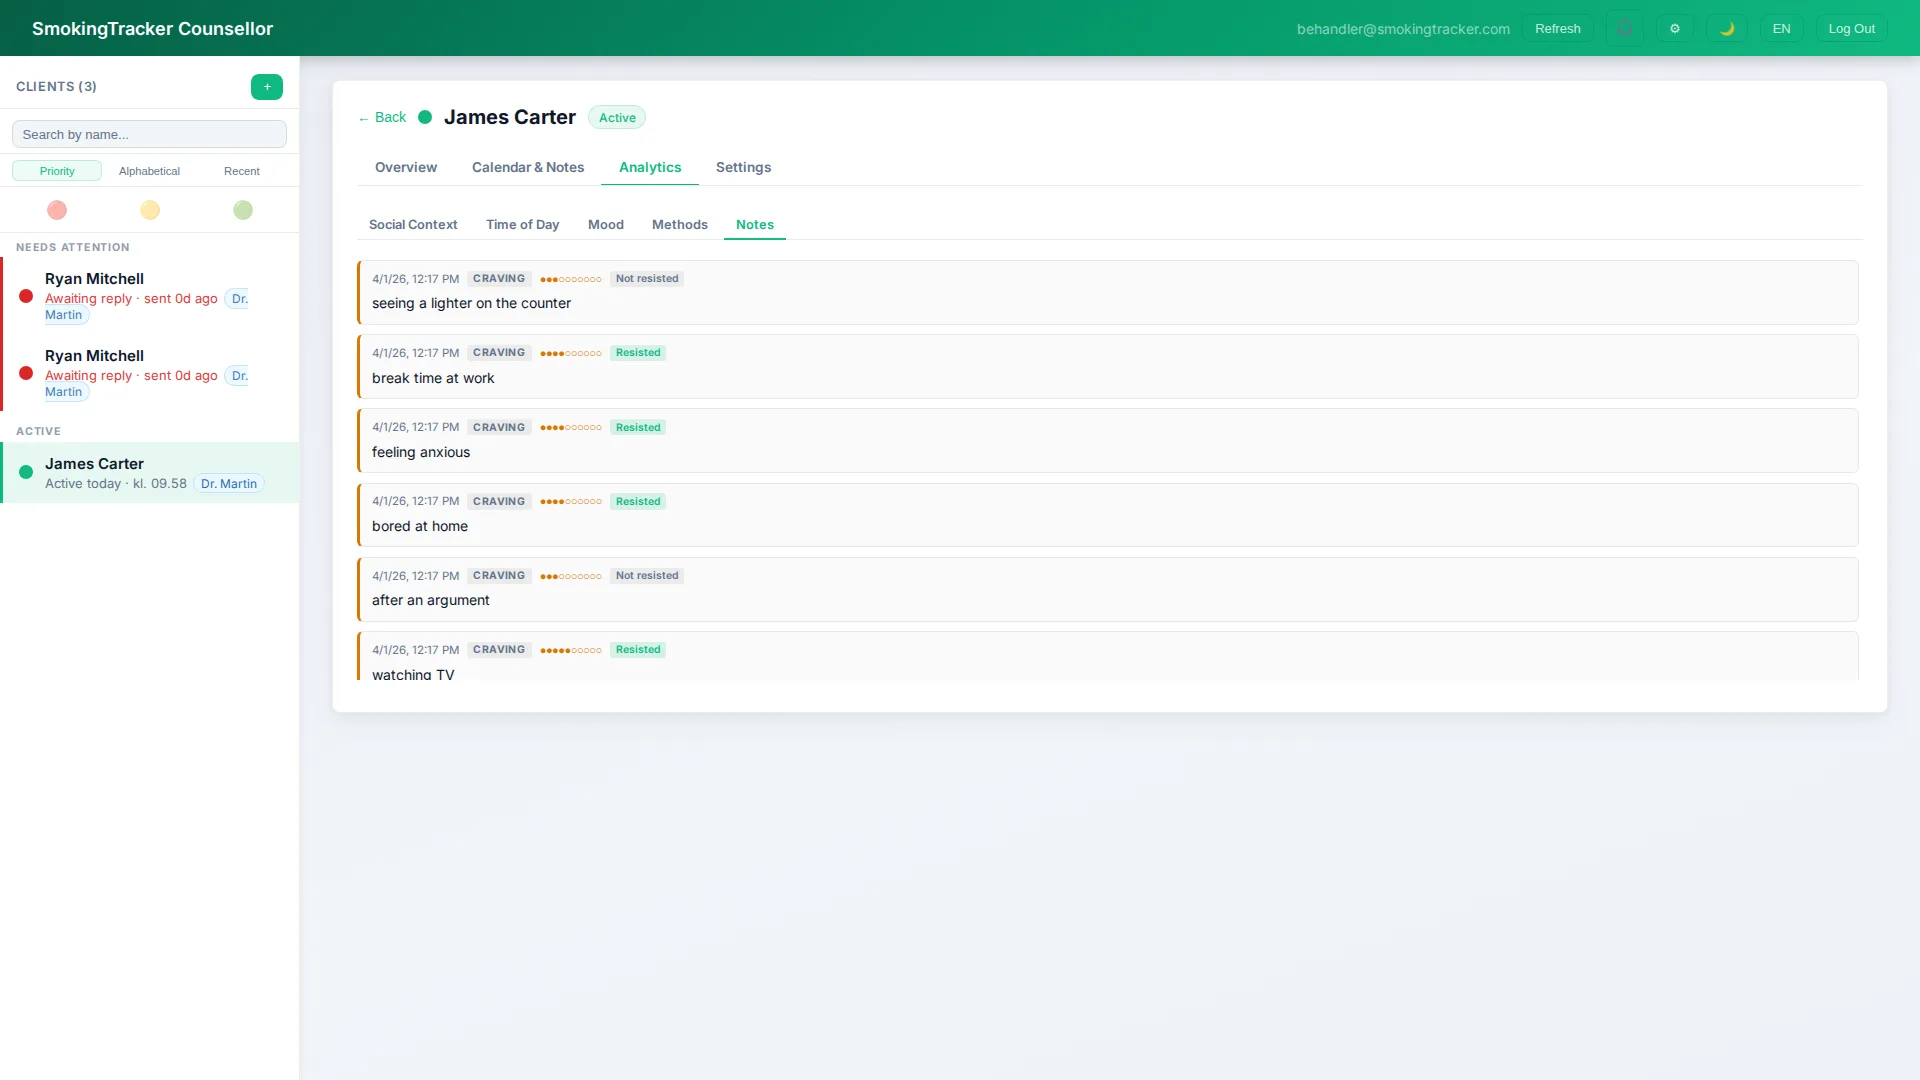
Generated reports include the data source, collection method (EMA), and time period — making them transparent and reproducible for EHR submission, supervisory review, insurance documentation, or cross-disciplinary referrals. No narrative invented from memory.
For supervised clinicians, SmokingTracker reports provide objective evidence of treatment progress that supplements session notes. For billing, the reports demonstrate ongoing clinical necessity using quantified outcome data — not subjective clinician judgement alone.
Structured outcome documentation improves treatment quality, payer relations, and clinical accountability.
Research in feedback-informed treatment shows that when clinicians have access to quantified outcome data, they adapt their approach more responsively than those relying on clinical impression alone.
Insurance and funding bodies increasingly require quantified evidence of ongoing clinical need. EMA-derived data provides a defensible, reproducible basis that session notes alone cannot.
Momentary capture eliminates the reconstruction errors that distort retrospective self-report — making EMA-derived reports a more accurate clinical record than questionnaire-based alternatives.
Sharing report content with clients as part of the therapeutic conversation increases insight, accountability, and motivation — an argument for using reports collaboratively, not just administratively.
Selected references:
Every session your client logs contributes to the report dataset in real time. Mood, triggers, method, amount — all timestamped and stored securely.
Annotate the data from the practitioner dashboard — flag events, add session notes, mark goal achievements. Your annotations will appear in context in the report.
Select the client, choose the date range, and click Export. A print-ready report opens in your browser — save as PDF and attach to any EHR system, referral, or supervision file.
The live data view that all clinical reports are drawn from — traffic-light status, trends, and triggers.
Learn more →The real-time capture that makes report data objective and defensible — not recalled.
Learn more →HIPAA, GDPR, and 42 CFR Part 2 compliance built into how data is stored and exported.
Learn more →Full reporting access during the free pilot. No setup fee, no automatic charges.
Get started today
Full access at no cost through October 2026. No setup fee, no automatic charges, no commitment required.